How sustainable is your car? That’s the question addressed by EnergyVille / VITO’s ecoscore. Each year, an analysis is made of the Belgian fleet, now consisting of some 5.8 million passenger cars. For 2019, figures demonstrate that the ecoscore of the Belgian fleet has increased again. Or in other words, we are driving more and more sustainably. This is also confirmed by the new registrations in 2019: the number of diesel cars decreases and the share of alternative vehicles in Belgium continues to rise.
The ecoscore
The ecoscore is an environmental score, developed by EnergyVille / VITO, which indicates on a scale from 0 (worst) to 100 (best) how environmentally friendly a vehicle is. The higher the score, the more environmentally friendly the vehicle. The major advantage of this method is that vehicles with different fuels and different technologies can be compared in the same objective way. This indicator takes into account both the well-to-tank emissions (WTT, or all emissions from production, transport and distribution of the fuel until it is in the tank) and the tank-to-wheel emissions (TTW or any emissions caused by driving the vehicle). When combined, this gives the well-to-wheel emissions (WTW).
2019: more environmentally friendly cars, especially for new registrations
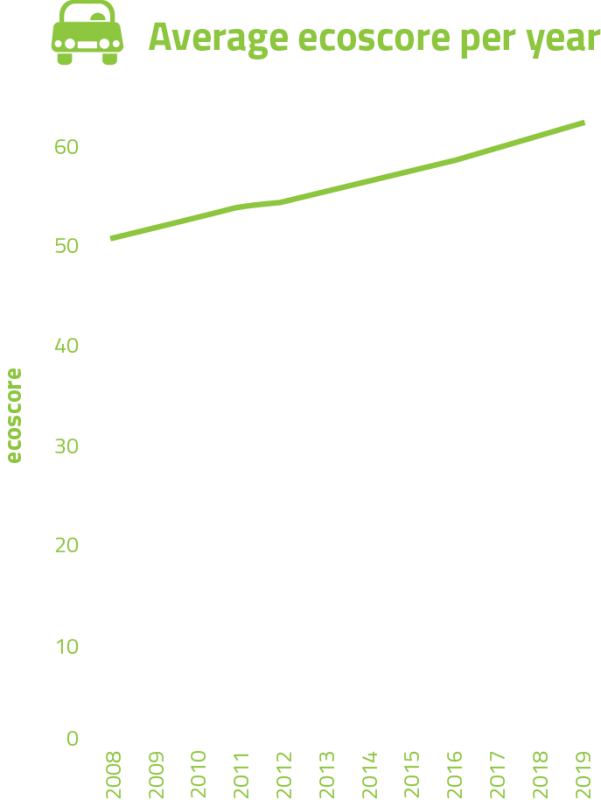
The Ecoscore research by EnergyVille / VITO makes it possible to perform analyses over the years. The Environment Department published a press release last week listing the key dates for 2019 which highlight that the average ecoscore of the Flemish passenger car fleet continues to increase by about 1 point per year. As such, we drive ever more sustainable cars. The average ecoscore of the total fleet of passenger cars registered in Flanders is now 62.2.
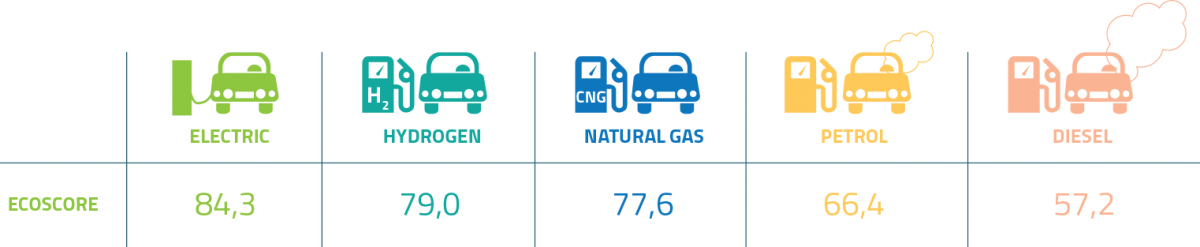
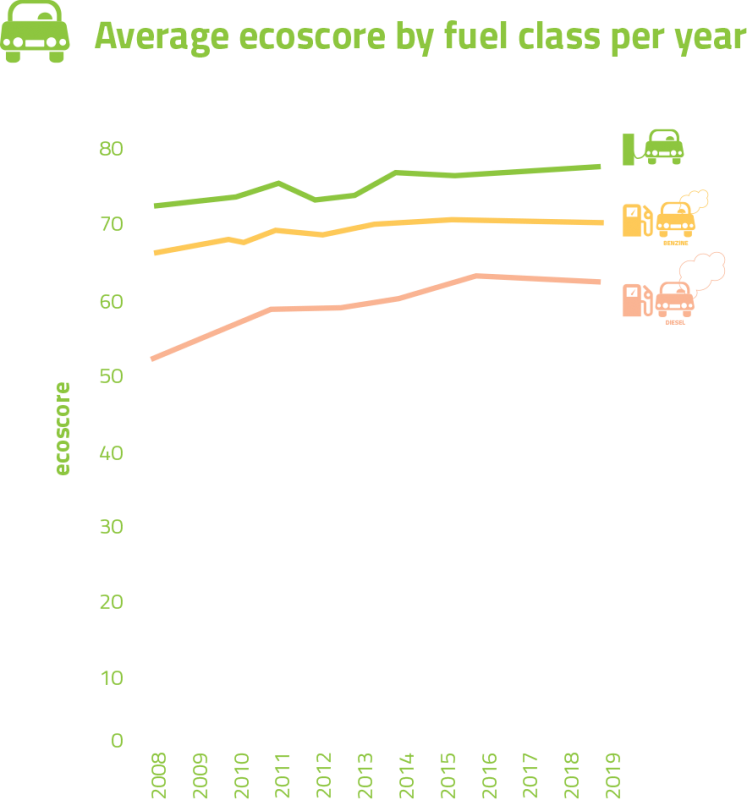
Additionally, the ecoscore study demonstrated a diesel car received by far the lowest ecoscore in 2019 (57.2). This is almost 10 points lower than the average ecoscore for petrol cars (66.4). Electric vehicles have the highest average ecoscore (84.3), followed by hydrogen vehicles (79.0) and natural gas vehicles (CNG, 77.6).
Less diesel cars, more SUVs
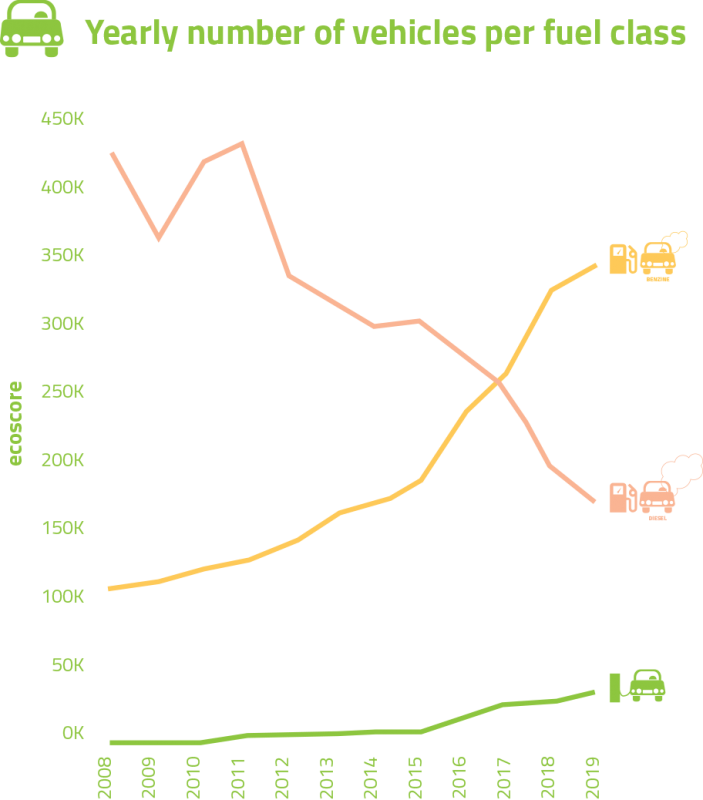
In 2019, there have been slightly more diesel cars (49%) than petrol cars (48%). For new registrations, it is striking that the number of diesel cars strongly decreases. Just over 30% of the new cars were equipped with a diesel engine. In 2008 this was the case for 4 out of 5 new cars. The share of alternative vehicles in the Flemish fleet is still small, at 3 percent, though an upward trend can be noticed. The alternative vehicles category includes fully electric or plug-in hybrid, hybrid (diesel / petrol), CNG, LPG and hydrogen (H2). In the new registrations an increase in alternative vehicles in 2019 to a total of almost 7% can also be noticed. Within the alternative vehicles, petrol hybrid vehicles still form the largest group (> 40%). Though the strong increase in electric cars is striking: they climb from 4th place in 2018 (12%) to 2nd place (24%). Electric vehicles double their share, leading to a total market share of 1.6% in 2019.
Another striking fact is the high number of SUVs. In 2019 there were almost 640,000 SUVs driving around in Flanders. Across Belgium, the milestone of 1,000,000 SUVs was easily exceeded. The share of newly registered SUVs rose from 17 percent in 2013 to 41 percent in 2019. In the most popular segment of small family cars, almost 6 out of 10 cars were of the SUV type. Unfortunately, this trend has a negative impact on the average ecoscore. The ecoscore for SUVs is 1.4 points lower than for non-SUVs. This is because SUVs are on average heavier (1517kg vs. 1370kg) and more powerful (106kW vs. 91kW) than other passenger cars. Partly for this reason, SUVs have a higher average consumption and therefore emit more CO2 (128g / km vs. 116g / km).
CO2 emissions are decreasing slowly but surely
The average CO2 emissions of the total fleet continues to decrease, though slightly less in the past year compared to previous years. In 2019, the average CO2 emissions of the total park were 136.1 g / km, a decrease of just under 2 g / km. Viewed at 10y, there has been a decrease of almost 30 g / km: from 165.7 g / km in 2009 to 136.1 g / km in 2019. For new registrations, after a consistent decrease of the CO2 emissions over the years, a small increase in average CO2 emissions was noticed: from 115.9 g / km in 2016 to 121.1 g / km in 2019, even despite the growing share of electric cars. The reasons for this increase are the introduction of a stricter consumption test (WLTP), the decrease of diesel cars and the growing popularity of the SUVs.

Want to analyse the data yourself?
Would you like to have a closer look at the Belgian passenger car fleet yourself? Or do you want to test how sustainable your own car is? You can! At www.ecoscore.be/en/fiches and www.ecoscore.be/en/fiches/new you can create your own statistics and graphs via a data visualisation tool.