EnergyVille: sustainable energy and intelligent energy systems
EnergyVille is a collaboration between the Flemish research partners VITO, KU Leuven, imec and UHasselt in the field of sustainable energy and intelligent energy systems. Our researchers provide expertise to industry and public authorities on energy-efficient buildings and intelligent networks for a sustainable urban environment. This includes, for example, smart grids and advanced district heating and cooling. At VITO, we develop innovative technologies, methodologies and tools related to the topics below.
Energy markets & strategies
VITO/EnergyVille studies the economic, technological and behavioural aspects of the current and future energy system, and provides advice on developments in the short and long term. We monitor the supply and demand of energy, carry out assessments and provide businesses and decision-makers at local, regional and European level with advice in the area of energy efficiency, renewable energy and flexibility.
Energy monitoring & policy
The most important reference for energy data in Flanders is the annual energy balance that VITO/EnergyVille publishes for the Flemish region, which includes an inventory of renewable energy and cogeneration (CHP).
Energy scenarios & strategies
In order to deliver the energy transition in a sustainable manner, businesses and decision-makers must come to informed choices. VITO/EnergyVille develops optimisation and simulation models that assist you by underpinning choices and scenarios with accurate insights into the potential, costs and impact of new technologies.
Interoperable flexibility trading solutions
Now that the use of renewable energy sources within our electricity network is on the increase, there is a growing demand for new technologies and processes that enable those energy sources to be integrated within the existing model. Interoperability forms a crucial challenge with regard to the energy market of tomorrow.
Interfaces for electrical storage
VITO/EnergyVille is an expert in providing a suitable interface between electricity storage units and their associated systems. The purpose of the hardware and software components involved is to make energy consumption within those systems more efficient, more flexible and more cost effective.
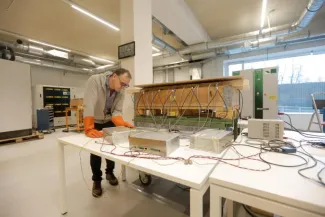
Tools & services to enable large scale application of electrical energy storage
VITO/EnergyVille has proven expertise in testing and assessing batteries, from cell through module to package level. We not only work with standard test procedures, but also develop and perform application-specific tests ourselves, which provide even more information about the actual service life and performance of the storage element.
Electrical energy storage technologies
VITO/EnergyVille offers tools such as BattSense and SmartCells that link up with energy management systems and ensure that the right control strategy is chosen at any time according to the final objective and the exact state of the storage unit.

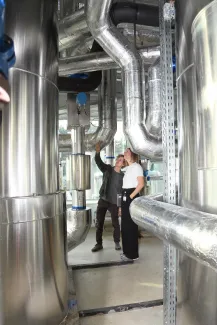
Optimisation of thermal energy systems
A sustainable future energy system requires thermal networks. In contrast to the centrally controlled heating networks of the past, these networks must now be optimally integrated into the energy system. This means that the aim should be maximum flexibility. These thermal networks should therefore also be combined with storage and conversion technology and intelligent control systems. The fourth generation thermal networks form a critical component of the infrastructure that will be needed to enable the large-scale integration of renewable energy sources.
Conversion technology
Thermal energy conversion involves the conversion of residual heat and heat from sustainable sources – such as solar energy, biomass or geothermal heat – to other energy carriers, such as electricity, heat at a different temperature level or cold.
Thermal networks
Heating networks can act as the link between the demand for and supply of heat. Moreover, they can provide the infrastructure for various forms of sustainable heat.
Thermal energy storage
Thermal storage is a key element in most energy systems and is crucial for achieving a sustainable future with low CO2 emissions. Thermal energy storage means surplus heat or cold is stored, ready for use when a future need arises.
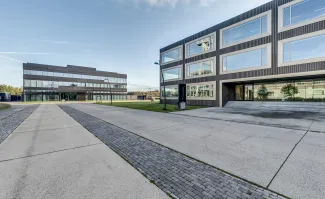
Buildings & Districts
Cities and communities play a crucial role in efforts to combat climate change, as they account for no less than 75% of our energy use. VITO/EnergyVille supports the European Commission, regional and local government bodies and businesses in the transition to a low-carbon and sustainable urban infrastructure. We do this by developing new technological insights, tools and evaluation methods, and by supporting new business models.
Energy districts design
Local communities and cities have a vital role to play in the transition to a low-carbon future. In 2050, half of all existing European buildings will still be in use. Optimising the energy profile of our cities has therefore become a top priority, requiring the right balance to be struck between energy efficiency, renewable energy and flexibility. Whether you are active in the public or the private sector, VITO/EnergyVille helps you make this energy transition. Our technological solutions are already being used in over 55 urban pilot areas across Europe.
Building assessment & circularity
The energy efficiency rating, the construction elements and the techniques and materials used are all factors determining the total energy consumption and environmental impact of the buildings that surround us. EnergyVille will help you reduce the environmental impact and energy consumption of buildings, building materials, technical systems and renewable energy systems.

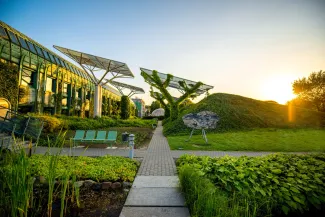
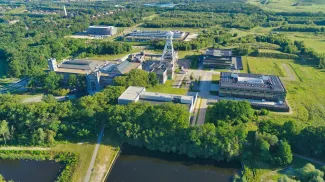
Living Lab test infrastructure
Meet Open Thor, a state-of-the-art living lab for the energy transition that offers, in addition to strategic infrastructure, a unique ecosystem of innovation where co-development and co-creation between scientific, industrial and residential partners are central. Also discover EnergyVille's labs here. These labs are available to our experts to conduct research, or you can also contact us to rent (part of) a lab.
Contact our energy experts
We are happy to help you with all your energy issues. Below you will find all our contact details. They will ensure that you are quickly put in touch with the right experts.
Energy markets and strategies


Interfaces for electrical storage

Optimisation of thermal energy systems


Buildings & districts
General inquiries

THOREAQ & Thermotechnical Lab
Control & Monitoring