EISSA: emission modelling
Effective air quality management heavily relies on the availability and the accuracy of emission datasets. At VITO, we ensure the highest quality of emission data for various types of application domains. EISSA is our unique system for inventorying and mapping air emissions at regional or local scale.
EISSA stands for Emission Inventory Support System – Air and is our product line based on the powerful EISS software.
EISSA accords with regional, national and/or European regulations and can be used for reporting air emissions, for compiling emission input to air quality models and for assessing emission related measures to improve the air quality.
It supports the entire emission modelling chain:
- Bottom-up emission calculations (both for historical and future years)
- Top-down spatial allocation of emissions
- Data management
This is possible thanks to its unique built-in functionalities. It makes the EISSA product line the number one choice to develop dedicated applications in Flanders and abroad.
The EISSA applications include EISSA-B, EISSA-POPs/NMVOS, EISSA Shipping, EISSA Slovakia, EISSA Spatial Gridding.
How does it work?
EISSA is an empty box that can be fully programmed for the needs of each individual application. This gives the customer a high degree of control.
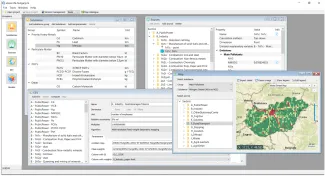
The configuration is done in 4 steps, in the 4 subsequent tiles seen on the left of the figure below:
- Definition of substances
- Definition of sources
- Attribution of emission explaining variables (EEVs): predefined algorithms to spatially allocate emission totals. They are configured in the initialisation step by our emission experts or can be set up by (or together with) the user.
- Bottom-up model definition: the model pane allows freedom to introduce sector-specific models, add a fixed pre-processor module, etc. It ensures compatibility with existing data sources or reporting formats.

A screenshot of the application developed for Hungary. The configuration is done in 4 steps with the 4 subsequent tiles on the left of the screen.
Output
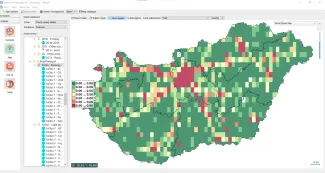
The EISS software has multiple built-in options for analysing and mapping the output, grouped in the Analysis tab (see figure from the EISSA Hungary tool).
After computation of the gridded emissions, the results can be visually displayed in the preferred aggregation level, edited for direct usage in reports and exported in internationally accepted reporting formats. The data can also be analysed in tabular format or ranked to accommodate quick analyses.

More information
If you would like to know more about EISSA and emission modelling, please contact Lisa. She will be happy to help.


