Accurate air quality maps
Air quality can vary considerably across a region. Higher concentrations of air pollutants are typically measured in our cities where there is a high density of population, traffic and industry. However, this air is also influenced by pollution sources situated outside our cities. This so called background air quality is composed of emissions from non-urban sources such as agriculture, (inland) shipping, natural sources and emissions in distant (urban) areas.
Impact of air quality on health
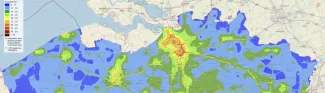
VITO’s ATMO-street model represents these varying concentrations across a region, taking into account the regional and urban background but also capturing so called street canyon effects into one single air quality map. With this information we can accurately assess the impact that the air quality has on our health. Using this information, policymakers can take action to reduce levels in pollution hotspots. The data can also be used in applications that can help us, the citizens, for example, to choose the ‘healthiest’ route to cycle to cycle or walk to work.
The current air quality maps for Flanders, generated by VITO are available from the official Flemish Environmental Agency website. The ATMO-Street model is currently being used in Flanders, China, India and Central and Eastern Europe.
Would you like to know more?
Wondering how ATMO-Street can help you draw up the right action plans for your policy? Get in touch with Stijn.