BREGILAB project releases online tool to visualize technical wind and solar potential within Belgium
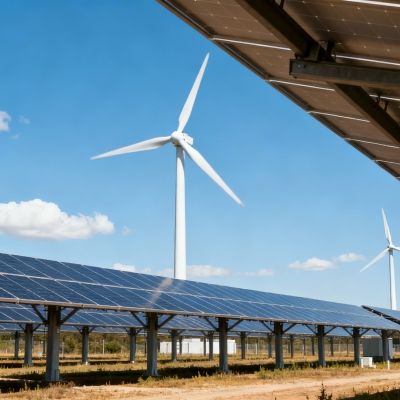
How much renewable energy from wind and sun can be generated within the Belgian borders? Where lies the biggest potential? And how can this extra capacity strengthen our electricity grid? These are only a few of the questions that BREGILAB, a research project launched in 2018 as part of the energy transition fund, investigated. The results and conclusions drawn from the project have now been made available in a handy tool that visualizes the technical potential of wind and sun in Belgium per region.
The BREGILAB project: making optimal use of renewable energy
The BREGILAB project, full name Balancing the Belgian electric system for maximum use of Renewable Energy generation by a Grid Injection Limit Algorithm and optimal Battery deployment, was launched in 2018 as an energy transition fund project and investigated how a balanced electricity system in Belgium could be set up at a minimal cost. The goal is to maximize the immediate use of locally generated renewable energy and to keep investment costs for the grid as low as possible.
How much additional wind and solar capacity is there in Belgium?
To gain insight into the possibilities regarding renewable energy in Belgium, the BREGILAB project in collaboration with imec, VITO and the Royal Meteorological Institute (KMI) also investigated how the current availability of wind and sun is distributed across Belgium, and where and how much potential renewable wind and solar energy generation are additionally (technically) feasible. This was done with the help of the Dynamic Energy Atlas (DEA), which is used to map and analyze both the current (status at 1.1.2018) and the potential electricity generation of wind and sun.
The strength of this tool is that (i) it calculates hourly renewable generation profiles with high spatial resolution and (ii) it contains a spatial optimization that enables the optimal location of wind and PV over Belgium. Since wind turbine construction permits are subject to safety and policy limits, a list of distance limiting criteria (e.g. the distance to domestic houses, transport infrastructure) and no-go zones must be taken into account when modeling the available space for additional wind turbines (e.g. nature reserves). Similarly for PV, specific technology assumptions were taken into account to assess solar capacity and generation. You can find more about the technological assumptions in this article.
The results: sufficient technical potential in Belgium to meet the climate ambitions
The analyses show that the technical potential for renewable energy generation from photovoltaic solar panels on roofs and onshore wind installations in Belgium can be estimated at 118 GW, which corresponds to a maximum theoretical electricity generation of about 132 TWh per year, which is more than the current demand of about 80 TWh per year from Belgium.
As such, the national and regional renewable energy ambitions for 2030 as set out in the National Energy and Climate Plan (NECP) for onshore PV and wind can be covered by using approximately 6% of the technical potential calculated for rooftop PV, and 17 % of the technical potential for onshore wind turbines.
A similar trend applies for 2050. As the data from the BREGILAB project were used as input for the PATHS 2050 platform – which tries to provide insight into how we can achieve climate neutrality in Belgium by 2050, based on various scenarios – we see that 90% of the calculated potential in wind and PV is included as part of the future energy system.
BREGILAB tool now also visualizes the exact location of potential wind and sun
So plenty of opportunities... But where exactly can we find this extra wind and solar capacity? To gain insight into the exact location of the extra potential for wind and solar energy in Belgium, the BREGILAB researchers have now also made the scientific data from the BREGILAB project available in an online tool. In this tool, you can see at a single glance how much wind and solar capacity has been available per region since 2018 and where there’s still potential for expansion.
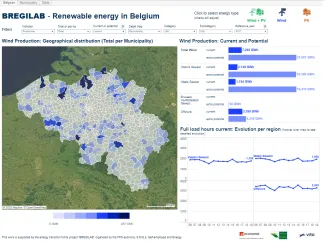
Interesting to note is that the port regions, the northern part of East Flanders and the southern parts of Luxembourg, Hainaut and Limburg, still have a great potential for wind. Highly urbanized regions, on the other hand, have a great potential for domestic PV and large-scale installations on the roofs of companies and SMEs.
The tool is yours now. Feel free to go through the tool yourself
A steppingstone to further policy ambitions
From the above tool and analyses it becomes clear that there is still a great potential to meet the climate objectives in Belgium. “With our spatially explicit approach, we provide an objective picture of the potential role of renewable energy in the future electricity system in Belgium, taking into account spatial constraints and opportunities,” explains Karolien Vermeiren, Business Development Manager at VITO and EnergyVille. “Although this primarily concerns a technical potential, it is important scientific input for policymakers, knowledge institutions and the business community. That is why we found it important to make the data publicly available, so that they can help aligning future policy ambitions.”
“Practice also shows that, for various reasons, only a limited amount of the potential will get licensed. VITO and EnergyVille therefore support regional governments, research institutes and the wind sector in the context of the current vision paper wind plan 2025 in carrying out additional analyses to provide insight into the impact of legal simplifications and mitigating measures on the potential,” concludes Karolien Vermeiren.
Useful links
-
Interactively analyse the availability of the renewable energy sources wind and solar at the level of the regions, provinces, municipalities and statistical sectors here.
- Want to know more about the BREGILAB project and the assumptions made? Feel free to go through the expert talk? “How much renewable electricity can be generated within the Belgian borders? (Dynamic Energy Atlas)”
- The BREGILAB project makes the data used for the above calculations freely available. The results are based on and subject to the assumptions specific to the BREGILAB project reported in the RES Generation: Wind & PV deployment evolution and availability factor (Clymans et al., 2022; VITO). The use of the results for purposes other than the BREGILAB study must always be done with due care regarding the original purpose. If you would also like to receive the results, you can leave your contact details here. You automatically receive by e-mail the raw basic data that have been aggregated in the viewer at the level of regions, provinces, municipalities and statistical sectors.
- Would you like to read the full report? Then you can do so via this link.
Would you like to know more about the project, are you interested in additional information or do you want to look into the possibility of cooperation on the subject? Please feel free to contact our experts.