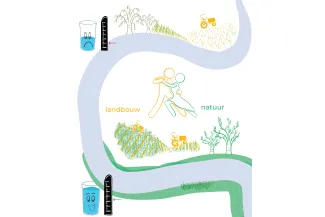
Nature and agriculture on the tandem towards water security
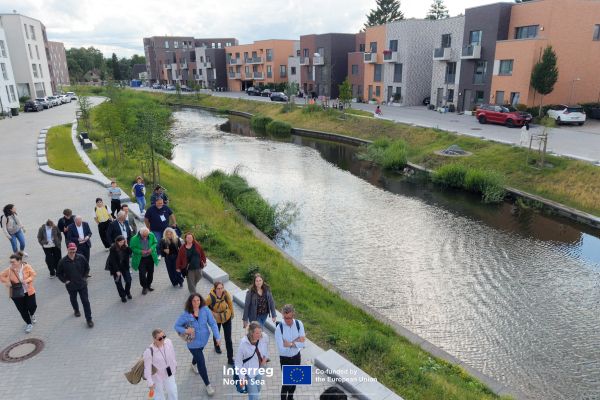
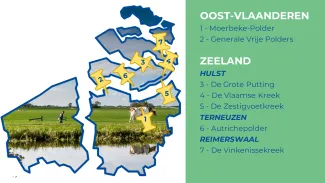
How can we create synergy between agriculture and nature to enhance our water security? What (water) gains can be achieved for both sectors? And can making these gains visible be a step towards collaboration? Can we map all this in a quick, accessible, and affordable way? We will tackle these questions through a quick scan in two demonstration regions in Flanders: Moerbeke-Polder and the Generale Vrije Polders.
Three years ago, our Northern neighbours inspired us with their quick scan methodology, as the Province of Zeeland has several years of experience with this approach and successfully so. But can this approach also work in Flanders? The short answer is: absolutely. The full answer, taking into account nuances, challenges, and concrete steps, follows below. The Province of Zeeland and VITO-Vlakwa joined forces within the Interreg Vlaanderen-Nederland project Aquatuur to provide a clear answer.
What exactly is a quick scan?
A quick scan maps out how we can utilise natural areas (with a focus on surface water systems) (i) to retain more water for the sake of nature, and (ii) to examine how agriculture can make use of a potential water surplus. Concrete questions are as follows: what water gain can be achieved by raising water levels for agriculture and nature? And what does such a rise in water levels mean for the area's water safety? Quality is also important, as the water quality on both the demand and supply sides must match.
In a quick scan, a water balance is established based on so-called incoming and outgoing terms: what and how much water enters the system and what exits? Such a quick scan is an accessible, affordable way to indicate the potential water security that a nature reserve can provide. To ensure a qualitative and easily understandable output, it is very important that such a quick scan is conducted in co-creation.
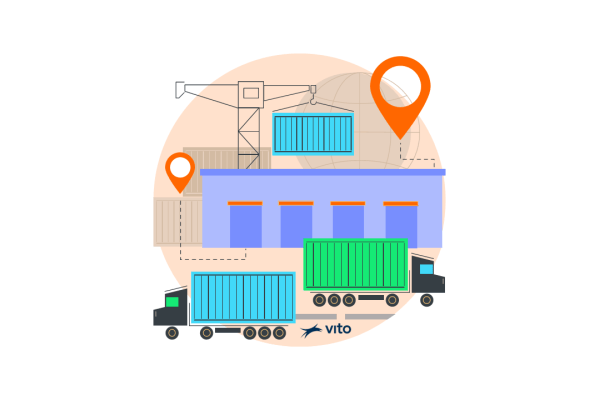
The quick scan focuses on areas where we can create a potential link between agriculture and nature and where there may be a need to simplify complex relationships. It is a conversation starter, a match, a way to simply indicate the (geo-)hydrological potential of a targeted area. It is a tool to initiate and facilitate cooperation between agriculture and nature.
The first step consists of a joint area determination, followed by an inventory of the available data from the area such as level agreements, existing habitats, hydraulic infrastructure, meteorological data, and water quality information. These data are then used to develop a water balance model that gives us insight into demand and supply from both agriculture and nature.
This is also mapped by the quickscan:
- The crop types that have appeared in the vicinity of the surface water system over the last ten years and their water demand (= demand side agricultural irrigation).
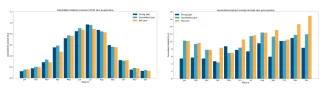
- The so-called incoming (e.g. precipitation & inflow) and outgoing terms (e.g. evaporation) and how they evolve in relation to the climate scenarios 2050Hd and 2100Hd. Hd is a situation where high emissions continue, resulting in a 'dry' scenario where winters become slightly wetter and summers become significantly drier. Each variable is plotted against a dry (20% driest years), average (60% intermediate years), and wet year (20% wettest years).
What results does such a quick scan deliver?
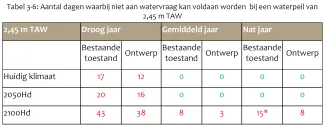
All results from the quick scan (can) be presented based on (i) the current condition, (ii) the designed condition, and (iii) the different water levels. This way, we can quantify the benefits for agriculture and nature based on various possible interventions.
Water Availability
1. Number of drought days: days when the minimum level for nature is reached, and when agriculture can no longer abstract from the surface water system.
html
2. Usable volume: volume of surface water that can be captured (plotted here as a function of time).
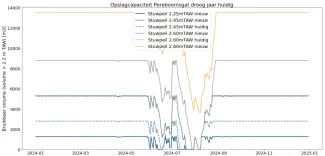
html
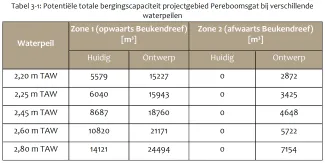
3. Potential storage capacity: total volume of water present in the surface water system
4. Useful potential storage volume: volume that can be extracted from the surface water system down to the lowest agreed level.
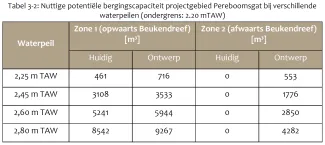
html
5. Irrigation demand at plot level (based on rainfall, crop type, and soil type - calculated via irrigation tool)
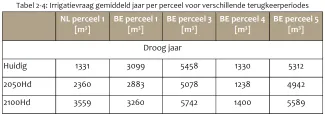
html
Water Safety
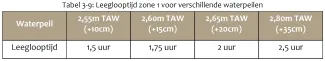
Drainage Time: time required to lower the surface water level to the desired level.
Water Quality
Chemical quality standards for irrigation water to avoid crop damage are compared with measured concentrations.
The above results are from the quickscan of the demonstration region in the Moerbeke Polder, conducted by IMDC and the Soil Service of Belgium (Bodemkundige Dienst).
The quickscan in the future
In the Moerbeke Polder, we have completed an initial quickscan from which valuable lessons were drawn and some shortcomings detected. In the future, we aim to add some indicators that can better represent the values and benefits for nature. For agriculture, stakeholders indicated that the current indicators in the quickscan methodology are sufficient.
A rise in water levels obviously affects the groundwater system, an important element for agriculture and nature. Within the second (yet to be investigated) area of the Generale Vrije Polders, we are looking at where the synergy lies with an existing GGOR study (desired groundwater and surface water regime). Once the results of that second area are known, we will fine-tune the methodology, spread the lessons learned in the low countries, and take actions to promote the rollout of this methodology.
And what about the results? What happens after the quickscan?
Mapping the hydrological potential of a project area is a step towards more water security in that project area. However, the results are useless if they are not supported or understood by a local coalition and if the non-technical barriers are unknown. Consider, for instance, thought patterns, institutional rules, required knowledge, or lack of connection between stakeholders.
When we want to implement innovation, we actually stumble less over the technological aspects than over the non-technological side of the story.
Finally: what values (to be valorised) do the achieved benefits actually yield for agriculture and nature? And how can we valorise these benefits in a jointly created value model?
To answer these questions, HZ University of Applied Sciences will develop a step-by-step plan based on the Moerbeke Polder case, which you can use. Soon, you will read in this newsletter an update on (i) the results of the quickscan in the various demonstration regions and (ii) the step-by-step plan to overcome non-technical barriers.