ATMOSYS air quality management system
ATMOSYS is a suite of ambient air quality software tools and apps that support policymakers, planners and industry to improve air quality, enhance wind comfort and ensure urban resilience. Our experts use advanced models and software tools to assess and plan for healthier, more sustainable and comfortable urban environments.
ATMO-Plan
ATMO-Plan is a user friendly web based decision support tool, designed to facilitate the assessment of the impact of emission reduction scenarios on air quality on an urban scale at a high spatial resolution. ATMO-Plan can be implemented in a regional or local administration:
-
To support the preparation of air quality action plans (as required by the revised EU Ambient Air Quality Directive 2024),
-
As a standard tool to harmonise air quality impact assessments required for environmental permits.
ATMO-Plan's main characteristics:
- The software is configured with all the necessary local emissions data to produce baseline high resolution air quality concentration maps for the country or region of interest.
- Local or open-source meteorological data can be used.
- Default data and mitigation options can be ‘predefined’ into the configuration e.g. low emissions zones, cleaner residential heating solutions, specific pollutants.
- The software can be tailored for specific assessment processes e.g. environmental permit processes and/or Environmental Impact Assessments (EIA)
- Users do not require air quality modelling expertise to use the software.
- It offers significant operational and administrative cost savings.
ATMO-Flow: Precision wind and air quality mapping for cities
ATMO-Flow generates metre-scale resolution maps of wind patterns, wind comfort, wind energy, and air quality. It incorporates detailed representations of buildings, vegetation and topography, enabling high precision simulations.
The Computational Fluid Dynamics (CFD) framework provides GIS ready outputs but also 3D visualisations, offering insights into wind and pollution patterns at different heights, making it essential for urban planners and environmental assessments.
Key features
- Explicit modelling of obstacle, topography and vegetation at metre-scale resolution.
- Unified tool to predict wind comfort, wind power, wind loading and air quality.
- Evaluation of measures to:
- Improve pedestrian wind comfort.
- Mitigate pollution hot spots and minimise population exposure.
- Optimise the placement of urban wind turbines.
- Mitigate wind related risks.
Applications
- City-scale analysis: Screening for wind comfort, urban wind power potential, air quality.
- Hot spot analysis (street canyon, tunnel outlets): Impact of mitigation measures, such as noise barriers, depressed roads, vegetation barriers, traffic patterns.
- Industry analysis: Emission quantification by means of Reverse Dispersion Modelling (RDM) and analysis of guided and non-guided emissions mitigation.
Discover other ATMOSYS products and services
Mapping air quality at street level
Air quality can vary considerably in a city. Concentrations measured on busy roads and streets can be significantly higher than average concentrations in the city. VITO has built up extensive experience in generating high-quality air pollution maps that adequately reflect this spatial variation.
- The underlying modelling technique (RIO-IFDM-OSPM) has been applied and validated in peer-reviewed publications.
- The methodology takes into account the double-counting effects of local sources in the regional and urban background and addresses the complex O3-NOx chemistry.
- The modelling chain is used in numerous cities across Europe, at the EU level, in China and India.
- Source allocation of the different types of sources (regional background, traffic, local heating and industry) can be represented.
Current annual average NO2 concentrations for Flanders, generated by VITO, are available on the official website of the Flemish Environment Agency. Zoom in on the NO2-map.
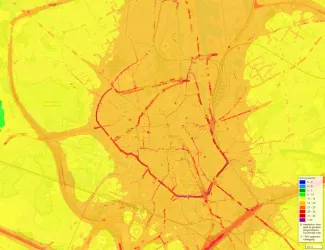
NO2-concentraties in Gent
Discover all ATMOSYS features
Feel free to contact Lisa. She will be happy to tell you more about ATMOSYS and our expertise in air quality management.
