More sustainable water management thanks to a flow of data
VITO and water-link are evolving from measuring to knowing to predicting with sensors.
‘Thanks to the data we captured with the sensor network that water-link and VITO rolled out on the Albert Canal and the Antwerp canal docks, we closely coordinated the management of our waterways with all the parties involved. We can see the impact our decisions are having and support policy and measures with factual insights. Proactively too.’ For Sven Kempeneers, Process Engineer at water-link, this is a major step in what began as a monitoring project with VITO. ‘After all, water is one system we all need to work with. In the most sustainable way.’
Blue Deal in practice
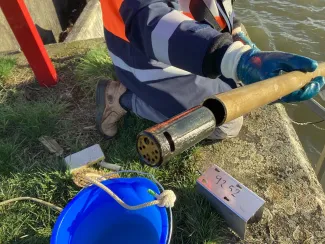
The collaboration started in December 2020. The first data was coming in as early as June 2021 from the 45 measurement points, which are equipped with CTD sensors (Conductivity – Temperature – Depth). This took place with European support from the H2020 project AquaSPICE.
‘This has all happened very quickly for such a long route,’ says Nele Desmet, VITO researcher, ‘because this type of sensor is amply suited to the measurements envisaged. But also because water-link knows the terrain exceptionally well, and we were able to build upon experience in similar projects.’
The reason for the collaboration between VITO and water-link: a need for continuous monitoring and systematic insight into the quality and quantity of the water in the Albert Canal, the raw water source for the water produced by water-link. In the light of climate change and the Flemish Blue Deal, which is asking for smarter water management precisely through technology and collaboration, the urgency is clear.
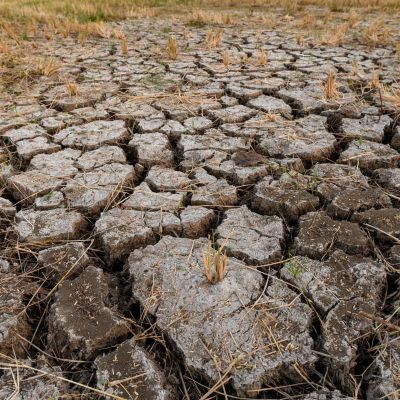
Wet and dry
‘Everything was ready by mid-2021,’ says Kempeneers, ‘in preparation for a period of drought. And then some hugely wet months came along. But it soon turned out that the system was also very solid in those circumstances. We were able to closely follow water in the canal coming from a flood and that may be contaminated. Live. And quickly take the right action. People just see canal water flowing; we see in our dashboards where any contamination may arise, where it originates, how it’s moving, how the salinity is changing. And in particular: the impact of measures also being taken by other parties, for example in a drought, such as pumping water back in.’

Quality and water level
In periods of continued drought, as we have seen in the past few years, interests need to be aligned. ‘In order to guarantee shipping, brackish water is sometimes pumped back into the end of the Albert Canal from the direction of the port docks. That water has a higher salinity, and may contain pollution. We always need to make sure this doesn’t affect our production,’ explains Kempeneers. ‘Now, we can monitor the quality continuously, thanks to the sensors. 24/7 in real-time.’
‘Thanks to the sensors, we also have an overall overview of the water level,’ Desmet adds. ‘This quantitative gauging is important for shipping, as the level is not always the same everywhere. Thanks to our complete overview, we can now see how much water is where and how the entire course can be kept at the right level, and where the supply could come from. Crucial information for De Vlaamse Waterweg, which manages the level.’
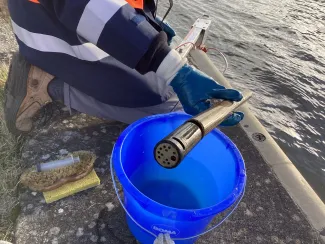
‘But all that technology doesn’t exclude people,’ explains Desmet. ‘Taking samples in-situ remains important, because you simply can’t adjust sensors to all the parameters. But you can take more targeted samples now.’ The water-link teams are now responsible for the maintenance of the sensors, so the data keeps coming in nicely. ‘Yes,’ says Kempeneers, ‘big compliments for the people in-situ who’ve gone through the switch as well.’
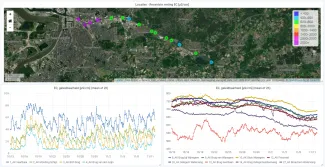
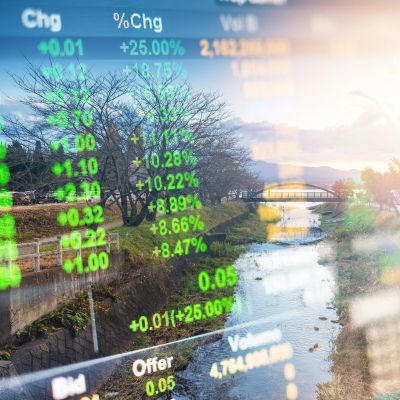
On top of this dashboard the sensor locations on the Albert canal are indicated starting from the connection with the harbour docks up to the water trap of Broechem. Close to the harbour of Antwerp the conductivity (salinity) of the water is higher (purple colour). Further east on the Albert canal the conductivity is lower (green and blue colour). At the bottom: Graphs with time series of measured conductivity in October-November 2022 at the different locations indicated on the map.
Safer, more caring, more efficient
‘You can see in that continuous flow of data that our collaboration is making the dashboarding more and more relevant,’ says Desmet. ‘You adjust visualisations, treat data differently, generate new insights. And that leads you to a system on which you can base operational decisions for all the parties involved.’
Kempeneers: ‘We now have a strong model, which we can use to align our measures far more closely. That has a big impact. We used to have to build in some major safety margins, and we couldn’t make the best use of our raw freshwater stocks. Today, we’re working more efficiently, and we can see quickly and accurately when we need to make which interventions. That saves money too. This is better for the water, and thus for all those involved, from the port to shipping, local authorities and citizens.’
From data to integrated water management
VITO is now further developing a model for making predictions for different scenarios that may occur in the future. What will happen shortly in times of drought, how much water do we need to pump back in, for example – and when? From where? What is the potential impact?
‘The fact is that we’re now managing our water system along with all those involved: De Vlaamse Waterweg, Port of Antwerp-Bruges, water-link. Our consultation, policy and decision-making are now substantiated from data, and our needs are aligned. From the beginning of the roll-out of the sensor network in mid-2021 to applied, integrated water management the year after,’ concludes Kempeneers, ‘which is a huge step forward.’