Unique computer model provides superior insights on air quality, wind comfort and wind energy in Antwerp
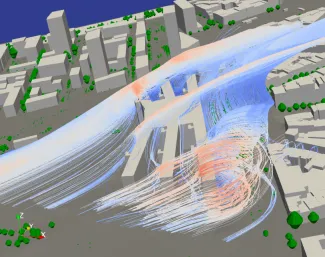
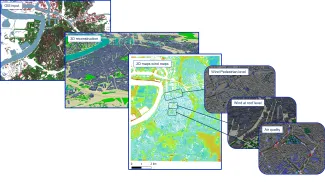
With ATMO-Flow, VITO developed a model framework based on Computational Fluid Dynamics, a technology that uses computer simulations to analyse airflows. This led to the creation of a unique 3D wind flow map of the entire territory of the city of Antwerp (9 by 9 km²). It brings a detailed picture of the city's air quality challenges down to 1 metre. The model also provides precise insights into wind comfort at all locations in the city, the impact of wind on the urban climate and the potential of wind turbines in the city.

Computational Fluid Dynamics
Computational Fluid Dynamics (CFD) is a method quantifying the movement of air currents and assess their impact on the environment. The ATMOSYS team at VITO uses this technology to create 3D models to assess air pollution at the micro-scale in cities and near complex industrial sites. Additionally, CFD can be used to estimate wind power and evaluate wind comfort.
Thanks to ATMOSYS' latest development, ATMO-Flow, which includes a collection of tools that process the built environment for use in a 3D model and drives the widely used CFD software ‘OpenFOAM’, it is now possible to create a high-resolution wind flow model of an entire city, in this case the city of Antwerp. The model has a very high level of detail and offers a unique combination of insights on air quality, wind climate and comfort, wind energy potential and also design options for a more sustainable city.
Building outline and vegetation
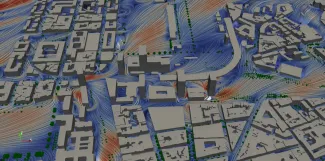
Jorge Sousa, air quality modelling researcher at VITO, explains how ATMO-Flow was created: “The basis for the model was the 3D building information of Flanders supplied by Digitaal Vlaanderen. This data was supplemented with detailed information on the contours of each building in Antwerp. The 3D geometric reconstruction was carried out using tools developed by TU Delft. We then devoted ourselves to accurately determining the current vegetation (location and size) throughout the city's territory, with a special focus on trees. This was done using Digitaal Vlaanderen's digital surface and digital terrain models, derived from remote sensing images.”
Air quality and much more
“The CFD modelled air quality maps provide an opportunity for a detailed assessment of the most challenging environments according to the European air quality standards, especially the locations where these standards are exceeded,” says Jorge Sousa.
“In addition to its potential for monitoring and addressing air quality issues, the model also maps wind currents with high resolution and enables reliable assessments of wind comfort, for example near high-rise buildings,” Jorge Sousa emphasises. The ATMOSYS wind comfort analysis is based on the Dutch wind comfort standard NEN 8100, currently the most widely used standard in the European Union.
At the same time, the model provides insight into the potential for wind energy on roofs and at ground level. Thus, the model also contributes to research and development on wind turbines for use in urban environments.
Last but not least, the maps provide an opportunity to study the influence of wind on urban climate and assess the impact of buildings and trees on urban ventilation during heat waves. This aspect of the 3D model came about with the help of VITO's climate impact team, a fine example of the multidisciplinary collaboration within VITO.
