Your reliable partner in the transition to a sustainable world
As a top European research centre, VITO and its 1,300 employees turn scientific insights into ground-breaking technological innovations, AI solutions and policy advice. We do so with a single objective: to help our world thrive for at least 1,000 more years.
35 years VITO: from research to impact
For 35 years, VITO has been building solutions to address the challenges of tomorrow. What starts as applied research evolves into technology, applications and impact in Flanders, across Europe and far beyond.
Explore the key milestones in our history and discover on the world map where and how many projects VITO realises worldwide.

Maximising our impact in three impact areas
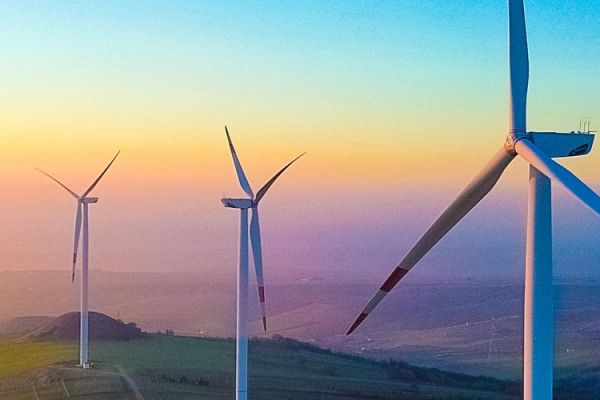
VITO is the science-to-technology partner for companies, governments and society in sustainability transition. We have focused our research activities on three domains in which we want to achieve maximum impact in Flanders, Europe and the world: a regenerative economy, a healthy living environment and resilient ecosystems.


Benefit from our expertise and infrastructure
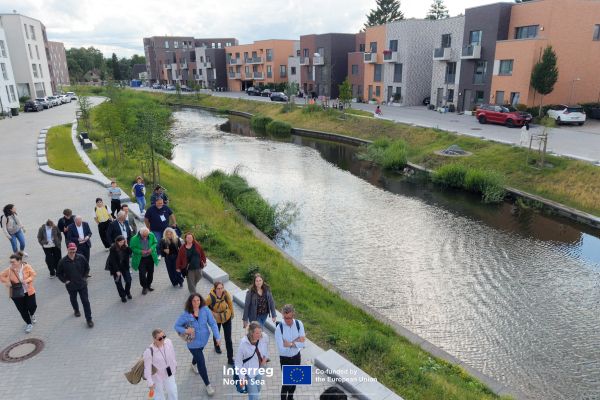
As a science-to-technology partner, we support companies, governments, and society in their sustainability transition. With our multidisciplinary approach and unique lab, scale-up, and testing infrastructure, we create practical technological innovations. As such , we accelerate progress towards a regenerative economy that reinforces planetary boundaries (prioritising electrification and circularity), smart climate solutions for resilient and secure ecosystems, and a healthy living environment harmonising humans, industry, agriculture, and nature.

Work together with VITO
VITO combines domain knowledge of people and the environment with technological innovations, (pilot) infrastructure and digital applications. Companies, governments and citizens gain access to our unique expertise. Together, we make a positive, measurable impact for a society in transition in Flanders, Europe and the world.
Companies
VITO supports companies in the sustainability transition, with technology and advice for workable and economically viable solutions. Scientifically based, focused on solutions and cooperation.

Governments
Policymakers can rely on the support of VITO's independent research to make science-based and policy choices and realise sustainable breakthrough projects.

Research & innovation
Every day, our researchers work on ground-breaking, innovative technological solutions to generate positive impact for a society in transition. We actively share our knowledge with companies and policymakers.

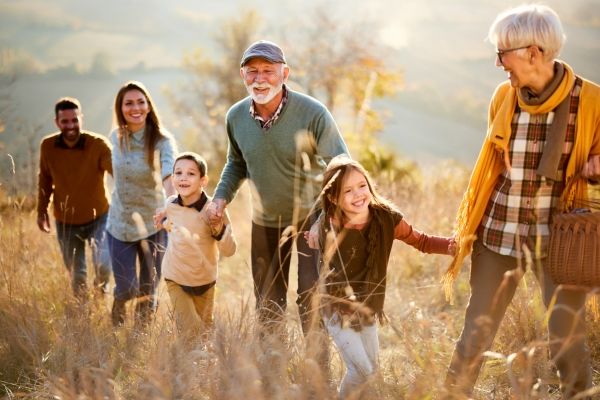
Society
Science is not just for scientists. We enjoy sharing our knowledge and want to get everyone excited about sustainable technology through science communication and STEM projects.


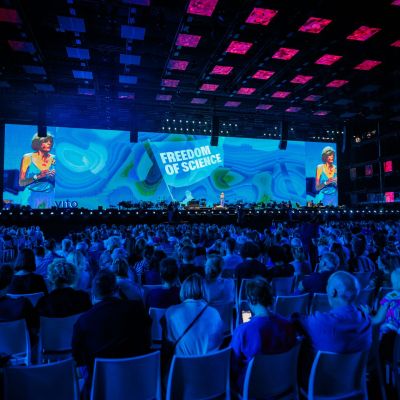
Meet VITO at inspiring events
VITO actively participates in national and international trade fairs, conferences and other events. We also often organise workshops, co-creation sessions and scientific lectures ourselves. Keep an eye on our agenda and register for interesting sessions.

News and project updates
Read our news items and updates on projects here.