Citizen science project maps heat stress in Johannesburg
Heat monitoring for cities, where a distinction can be made at neighbourhood level, is still in its infancy in Africa. VITO is now changing that. In and around Johannesburg, it hyper-accurately mapped heat stress in six different neighbourhoods in early 2022, during the South African summer. This was done in close cooperation with the local population. The resulting maps show huge differences between rich, residential neighbourhoods and poor townships.
While cities are warmer than rural areas anyway due to the heat island effect, climate warming amplifies that difference. But there can also be significant differences within cities and densely built-up agglomerations, and these too are amplified during heat waves, for example. Illustrative of this are cities in South Africa whose spatial planning is still strongly determined by Apartheid. For instance, neighbourhoods with a traditionally black population tend to have much less urban greenery in the form of trees along roads, gardens and parks than formerly exclusively 'white' neighbourhoods. Moreover, the houses in these so-called townships are often of poor quality, making it difficult for them to keep out the heat - let alone be air-conditioned. On the contrary, some shelters turn into 'ovens' during a heat wave in which people can barely stand it. If there is then no cooling nearby, a heat wave can be really debilitating and seriously threaten the health of the residents.
Climate adaptation measures
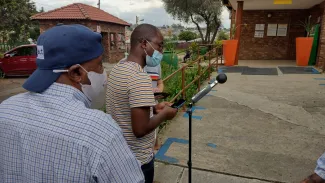
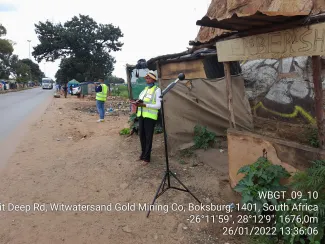
But residents of the townships are not sitting back. In early 2022, when it was summer in South Africa, over a hundred volunteers from Johannesburg and the Ekurhuleni suburb took to the streets to map heat stress. They did so at the request of VITO, which in turn was selected for this purpose by the World Bank. Heat stress monitoring was part of the Global Facility for Disaster Reduction and Recovery, a programme coordinated by the World Bank that helps developing countries take so-called climate-adaptive measures to mitigate the local impact of global warming.
Specifically, the monitoring project aimed to gain more insight into the differences in heat stress between different districts, into the various factors on which heat stress depends such as temperature, wind and heat reflection through the soil, and into the effect on it of spatial elements such as buildings, shade and vegetation.
VITO carried out the project in close collaboration with Planact, a South African NGO that makes people in deprived neighbourhoods more aware of issues that threaten their quality of life, and more empowered so that they feel less hesitant to raise problems with, for example, the government. 'In South Africa, it is the poorest communities that are suffering the hardest from the effects of global warming,' says Planact's Fred Kusambiza. 'With this initiative, they could educate themselves better. About the causes of global warming and the fight against it, but above all about measures they can use to protect themselves, which often don't even cost that much.'
Planact took charge of recruiting local volunteers and was responsible for the practical organisation. This was necessary, because corona events prevented the VITO experts from travelling to South Africa themselves at the end of 2021. 'A new virus variant had just emerged there, and suddenly it was no longer possible to travel there,' says Koen De Ridder of VITO. So the collaboration was necessarily conducted online, which was a bit of a struggle at first. 'We had to explain via video meetings how the measuring equipment we had sent over there worked, and how to use it correctly.' In March 2022, the experts were finally able to travel to South Africa.
In the weeks before, in January and February 2022, the volunteers had taken to the streets with the measuring equipment. Six neighbourhoods in Johannesburg and Ekurhuleni were measured in the process, spread over six different days. In the morning, the volunteers were briefed on what exactly they were going to do that day, and why. De Ridder: "They were given information about global warming and how this will increase heat stress in their city. Then they were explained how the measuring equipment worked, and after lunch they could then take to the streets in groups of two.' That the monitoring was carried out by local volunteers is an absolute plus of the project, which can therefore be considered a strong example of citizen science or citizen science. 'It creates trust in the research.'
That trust is indispensable, because the project's results are, of course, intended to lead to concrete measures to combat heat stress. 'Nowadays, there is a strong emphasis on local climate adaptation, for example by providing more greenery in cities - so-called nature-based solutions,' says De Ridder. 'This is also what the latest IPCC report on the fight against global warming says. But when local policymakers are shown such a heat stress map of their own city, which, moreover, was created with the help of their own population, it has greater persuasive power than a general scientific report.' The heat stress maps came about partly thanks to satellite data used as input in an urban climate model by VITO. Ground measurements of heat stress were used as validation. In addition to the measurement campaigns, simulations of heat stress were carried out with the VITO climate model, both for the present and for the future.
Differences between townships and residential districts
On the maps, the differences between the neighbourhoods measured are often very large, especially between the prosperous, residential, 'green' neighbourhoods and the poor townships. In some townships, there is hardly even any greenery present, resulting in a so-called wet bulb globe temperature that is much higher. That temperature, recorded by the volunteers on site in the six districts, measures the combined stress caused by heat, humidity and radiation exposure. If this temperature reaches 35 degrees, the human body can no longer cool down by sweating, a life-threatening situation. The fact that heat stress was measured here for the first time on a meter scale, incidentally, makes the differences between green neighbourhoods and townships even more apparent.
But ordinary temperature differences also spoke volumes. For instance, it is sometimes six degrees warmer in townships than in residential areas. This also affects night-time temperatures, which can remain uncomfortably and even unhealthily high due to the heat island effect. According to the VITO climate model used, if policies remain unchanged, townships will have more than 100 such extremely hot nights every year by 2050, compared to only 40 in wealthier neighbourhoods. 'Citizens who want to convince local politicians of the importance of climate-adaptive measures in the city therefore have a powerful and scientifically based tool in their hands with the results of our project,' says De Ridder. According to Fred Kusambiza, this has already had an effect. 'In several townships, residents have urged the local government to plant more trees in their neighbourhoods. They are also demanding that their children be more and better informed at school about global warming and its consequences, as this also concerns the younger generations.'
With the development of heat stress maps for Johannesburg and Ekurhurleni, VITO performed pioneering work. 'In Africa, such maps at the city level, where it is possible to distinguish between different neighbourhoods, are very scarce.' But this is now slowly changing. In fact, this year VITO is conducting a similar exercise in Niamey, the capital of Niger. VITO experts will travel there in March 2023, and this time corona will not be able to stop them.
More info on this project
WorldBank: Beating the heat in South African cities: Lessons from a citizen science assessment
Article on ScienceDirect: Urban heat in Johannesburg and Ekurhuleni, South Africa: A meter-scale assessment and vulnerability analysis
Info about VITO's UrbClim - Urban climate modelling
The UrbClim model is the result of protracted development. Today, it has already been used successfully in many cities worldwide (Almada, Antwerp, Barcelona, Berlin, Bern, Bilbao, Brussels, Delhi, Ghent, Hasselt, London, Paris, Praque, Rome, Skopje, Tilburg and Vienna). UrbClim is also used in several service projects for local, regional, national and international organisations.
