Belgium's three regions launch Life Cycle Impact - a new comprehensive environmental label to compare cars
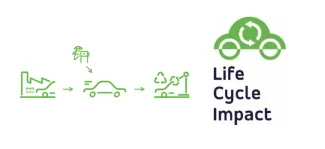
Today, Belgium's three regions are launching the Life Cycle Impact: a new, comprehensive environmental score that enables like-for-like comparisons between cars based on their total impact over the full life cycle. Developed by VITO/EnergyVille and VUB as an extension of the Ecoscore, it condenses into a single figure the impacts of vehicle production (including the battery), fuel or electricity production, and use (200,000 km)—and goes beyond climate change by also accounting for effects on human health and ecosystems. Through www.lifecycleimpact.be, anyone can look up a model’s score or retrieve (via the chassis number) and calculate the score for their own car.
Summary
- VITO/Energyville and the VUB have been commissioned by the three regions to develop an extension to the Ecoscore: the Life Cycle Impact. A single figure shows the overall environmental impact generated by a car over its entire lifetime. This includes the production of the car (including any battery), the production of the fuel, driving the car and the share of recycled materials.
- The Life Cycle Impact goes beyond climate change, and also includes impact on human health and ecosystems.
- You can find the Life Cycle Impact of any car on the website www.lifecycleimpact.be. You can also find the Life Cycle Impact of your own car using the VIN[1], or calculate it yourself.
- The Life Cycle Impact clearly shows that, when comparing similar cars, the batteryelectric version is always the smartest choice from an environmental point of view, whether it's a city car or a heavy SUV. The diesel car is always the worst option.
- It is also clear that within the same fuel or powertrain, larger vehicles always score worst than smaller vehicles. The share of the impact of the vehicle (and battery) production is becoming an important contributor to the overall Life Cycle Impact, since on the one hand the environmental impact of electricity production (for battery electric vehicles) is decreasing, and on the other hand the level of tailpipe pollutant emissions (for ‘traditional’ combustion engines) is also decreasing.
- Even with the higher vehicle and battery mass, electric vehicles in general have the lowest Life Cycle Impacts. However, it would be too simplistic to claim that battery electric cars always have a lower environmental impact than any petrol car. The life cycle impact of a heavy electric car with a large battery can exceed that of eg. a smaller petrol car. However, comparing vehicles of different segments may not be relevant, as consumers usually don’t hesitate between a small car and a heavy SUV.
- Private individuals generally buy smaller models: the average weight of the 10 most popular new private cars of 2025 is significantly lower (-800 kg) than that of the 10 most popular new company cars.
- Despite their higher weight, the 10 most popular new company cars have a slightly lower average Life Cycle Impact than the top 10 new private cars. This is due to the fact that the top 10 company cars are all fully electric.
- When addressing the environmental impact of products, in this case cars, it is important to not only consider the use phase, but also the impact of the production of the materials used. It is to the credit of the Life Cycle Impact that this has become tangible for cars.
[1] VIN: Vehicle Identification Number.
Introduction
As was the case throughout 2024, half of all new cars of 2025 were equipped with a larger than a regular (12V) car battery: ranging from conventional hybrid cars (12%) to plug-in hybrids (9%) and fully electric cars (34%). However, battery production is an environmentally damaging process and is often used as an argument to claim that electric cars are not more environmentally friendly than traditional cars with combustion engines. In addition, the batteries in plug-in hybrid and battery electric vehicles (BEV) are becoming larger, which of course has advantages in terms of ease of use and the number of kilometers driven electrically, but perhaps tips the balance?
The Ecoscore has already shown that BEVs are the best choice when you take into account the impact during driving and during the production of the required fuel. However, the Ecoscore does not take into account the production and recycling of the car itself. In addition, the high Ecoscore of BEVs meant that we could not really differentiate between BEVs.
For these reasons, the three regions asked VITO/Energyville and VUB MOBI to develop a second indicator that would offer a solution. This resulted in the Life Cycle Impact.
Life Cycle Impact
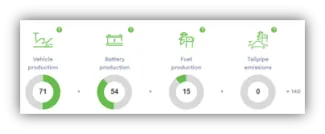
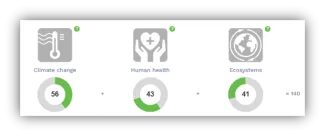
The Life Cycle Impact provides an indication of the overall environmental impact that a car generates over its entire lifetime. The lower the Life Cycle Impact, the less environmental impact is generated. The car's contribution to global warming and its impact on air quality (human health and ecosystems) are taken into account. Emissions during driving, during the production of the required fuel, and now also during the production, including recycled content, of the car itself are all included.
Methodology
To map the overall environmental impact that a car generates over its entire lifetime, Life Cycle Impact applies a life cycle assessment (LCA) approach. This LCA approach is based on the European recognized Environmental Footprint method.
To calculate the Life Cycle Impact, we take into account the emissions that occur during:
- The production and assembly of the car: bodywork, interior, engine parts, battery(ies), etc., including the share of recycled material.
- The use of the car (exhaust emissions), assuming that a car travels a total of 200,000 km during its lifetime.
- The production and distribution of the fuel or energy carrier used by that car: crude oil refining, electricity production, etc. With regards to electricity production, we use a prospective approach, assuming that a.o. the carbon intensity will decrease over the lifetime of the car.
We then map the contribution of these emissions to the following Environmental Footprint impact categories:
- Climate change.
- Human toxicity (non-carcinogenic), smog formation & particulate matter emissions. On the website, these are grouped under the heading ‘Human health’.
- Acidification, ecotoxicity (freshwater) & eutrophication (land and sea). On the website, these are grouped under the heading ‘Ecosystems’.
A remark with regards to plug-in hybrid vehicles (PHEV): in the calculation of the Life Cycle Impact, we do not use the official (type approval) values for CO2-emissions and electricity consumption. The type approval values assume a high proportion of electric driving, while real world driving data prove otherwise. This real world driving data indicate that the CO2-emissions and fuel consumption of plug-in hybrids are much higher than what the ‘official’ figures indicate. This also means that the share of electric kilometers is much lower than what is being assumed to date[2]. In the Life Cycle Impact, we therefore apply a more realistic approach. This approach is based on the way the official CO2-emission and electricity consumption of plug-in hybrid cars will be calculated from 2027 onwards, which is on its turn based on real world driving data of current European plug-in hybrids. The share of electric kilometers is in that approach more in correlation with the distance the car can drive on a full battery and is (much) lower than the electric share from the current official calculation method.
Research also indicates some EV batteries are capable of driving up to 1.000.000 km, or in other words much longer than the lifetime of an average car. However, since there is currently no large-scale reuse or other second-life applications for EV batteries, this is not yet taken into account when calculating the Life Cycle Impact.
[2] Belgian real world data would indicate that on average only 26% of the kilometers are driven on the electric engine, the remaining 74% are driven on the combustion engine.
www.lifecycleimpact.be
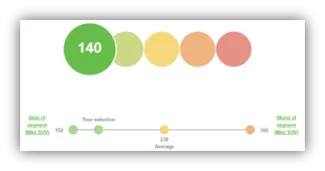
On the www.lifecycleimpact.be website, you can find the Life Cycle Impact of any car. You can do this using an overview of all cars that are available new or used in Belgium. You can also see how the Life Cycle Impact of that car is built up: we show the contribution of each life cycle phase and the breakdown into impact categories. We focus in this article on new cars, but also for 2nd hand cars the website gives you insight in their Life Cycle Impact.
For battery electric and plug-in hybrid cars, we assume that they are charged using the average Belgian electricity mix (incl. future decarbonization), but you can also simulate the effect of charging with a green electricity contract, and even charging with your own solar panels.
You can also find the Life Cycle Impact of your own car using the VIN, or calculate it yourself.
Some results…
To get a feel for the Life Cycle Impact, we have compiled some telling results for new cars below.
Small family cars
In Table 1, you can find the Life Cycle Impact of a typical new small family car (such as a Volkswagen Golf, Citroën C4, Opel Astra, Toyota Corolla, etc.) for each fuel (or powertrain) available on the market.
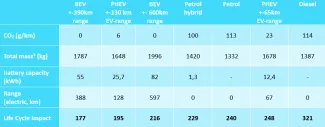
Table 1. Life Cycle Impact of example vehicles from the ‘small family cars’ segment
*5 We refer to the Mass in Running Order when mentioning (total) mass or weight of a vehicle.
Key conclusions for new small family cars:
- Despite weighing up to 455 kg more than the lightest car in the table, the battery electric version (with +-390km range) is clearly the choice with the lowest overall environmental impact.
- Small battery electric family cars with large batteries can have an environmental impact which is higher than that of the best scoring plug-in hybrid of that segment. It must be said that this plug-in hybrid is the best in class, since the vast majority of the plug-in hybrids in this segment have relatively small batteries allowing only a limited amount of electric kilometers, and have therefore Life Cycle Impacts that are higher than those of similar electric cars with large batteries.
- The same battery electric family car with a large battery still scores better than a comparable plug-in hybrid with a limited electric driving range (the majority of the plug-in hybrids), and significantly better than ‘traditional’ petrol or diesel small family cars.
- The impact of PHEVs is largely determined by the distance they can drive on electricity (before switching to the petrol engine). A ‘larger’[3] battery is therefore still an advantage in terms of Life Cycle Impact for a PHEV. It can be clearly seen in the table that PHEVs with regular size (‘small’) batteries even have a higher environmental impact than ‘traditional’ petrol cars.
- Diesel cars have the highest Life Cycle Impact due to the higher impact of their tailpipe emissions on air quality, but also due the higher weight of diesel cars compared to similar petrol cars.
[3] ‘Larger’ is relative, however, as these batteries are still smaller than the smallest battery in modern electric cars.
Most popular models of 2025
In Belgium, the most popular engine type among the new private cars of 2025 is still the petrol engine: almost two out of three new private cars have a petrol engine. Only 9% of private cars are electric. In the case of company cars, however, favorable tax treatment works in favor of battery electric cars: just over half of the new company cars are fully electric (54%).
In 2025, the scope of the favorable tax benefit was initially[4] further narrowed to BEVs only. Since the beginning of 2025, a decline in the number of new company cars can be observed. In the record year 2023, just under 334,000 new company cars were registered, and this has dropped to just under 240,000 in 2025. In contrast, the number of new private cars stays quite stable. It is not clear what caused this decline in company car registrations: the initial narrowing of the tax benefit to BEV-only, the uncertainty regarding the tax benefit for plug-in hybrid cars, a combination of both, or …
In the tables below, we have included the Life Cycle Impact of the most popular new models of 2025. We distinguish between those purchased by private individuals and those registered as company cars.
[4] In the course of 2025, legislation changed and some PHEVs became fiscally attractive again.
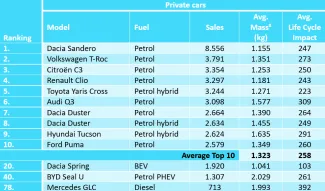
Table 2. The 10 most popular new private cars of 2025, supplemented by the first of each fuel type according to their position in the ranking
*8 We refer to the Mass in Running Order when mentioning (total or average) mass or weight of a vehicle
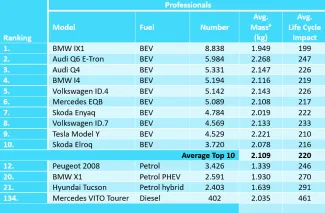
Tabel 3. The 10 most popular new company cars of 2025, supplemented by the first of each fuel type according to their position in the ranking
*9 We refer to the Mass in Running Order when mentioning (total or average) mass or weight of a vehicle
Key conclusions for the most popular models for new cars:
- Private individuals tend to buy smaller models: the average weight of the 10 most popular new private cars is significantly lower (-800 kg) than that of the 10 most popular company cars.
- There are no BEVs in the top 10 private cars, whereas the top 10 company cars consist solely of BEVs.
- Despite their higher weight, the most popular company cars have a better average Life Cycle Impact than private cars. This is due to the fact that the 10 most popular company cars are all electric.
- The most popular diesel car has a much higher Life Cycle Impact than the other fuels, both for new private cars and new company cars.
Lowest & highest Life Cycle Impact
To put the above results into context, we have also compiled tables showing the new cars with the lowest and highest Life Cycle Impact for different fuels.
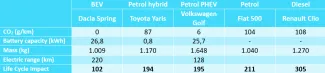
Table 4. New cars with the lowest Life Cycle Impact for different fuels
The cars with the lowest Life Cycle Impact per fuel are all (small) city cars, with the exception of the plug-in hybrid car. There is simply no small city car available in plug-in hybrid version. The battery electric car is clearly the best choice in terms of environmental impact in this segment.
The cars with the highest Life Cycle Impact all turn out to be large SUVs. Here too, you can see that the battery electric version is once again the best choice within the same segment. On the other hand, it also appears that this large battery electric SUV has a greater environmental impact over its lifetime (Life Cycle Impact of 336) than a petrol family car (e.g. Mercedes C-class, Life Cycle Impact of 299) or a petrol medium SUV (e.g. Peugeot 5008, Life Cycle Impact of 282). Electric family cars and electric medium SUVs, in turn, have a lower life cycle impact than their petrol counterparts.
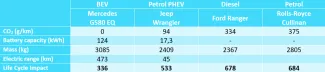
Table 5. New cars with the highest Life Cycle Impact for different fuels
Future developments
Below are some future developments that may have an impact on the Life Cycle Impact. These various aspects will be closely monitored and, where possible, integrated into the Life Cycle Impact.
- Thanks to the European battery regulation, the decarbonization of the electricity mix, improvements of batteries and higher share of recycled materials, the impacts of battery production could significantly be reduced in the near future. This in turn could result in a decrease of the Life Cycle Impact of battery electric and plug-in hybrid cars. The decarbonization of the electricity mix for the use stage is already accounted for in the current version of Life Cycle Impact.
- The Life Cycle Impact considers the current share of recycled material in cars and batteries. This share will continue to increase in the future, partly due to European regulations. This could further benefit all cars, and more specifically battery electric cars, as the battery has its specific recycled content target.
- The current Life Cycle Impact assumes a vehicle lifetime of 200,000 km, reflecting average driver usage. However, battery lifetimes may be longer than 200.000km, notably for larger batteries. This is due to lower degradation, potentially extending vehicle use. This also enables second-life applications, such as reuse in another vehicle or repurposing for stationary storage. Along with expected reductions in production-related impacts, these factors could further lower the overall environmental impact of batteries. However, more research is needed since trade-offs could arise between using larger, longer-lasting batteries on the one hand, and on the other replacing them with future, more efficient and more decarbonized, batteries. As second-life applications are still under development, these are not integrated in the Life Cycle Impact.
-
Non-exhaust emissions such as tyre or break wear are not yet included in the Life Cycle Impact. There still is uncertainty with regards to emission factors for the different types of cars. Things might evolve in the future, given e.g. the Euro 7 regulation which also covers some non-exhaust emissions. This aspect will be followed-up closely, and if possible integrated into the Life Cycle Impact.
Takeaways
- The Life Cycle Impact clearly shows that, when comparing similar cars, the battery electric version is always the smartest choice from an environmental point of view, whether it's a city car or a heavy SUV. The diesel car is always the worst option.
- It is also clear that within the same fuel or powertrain, larger vehicles always have a larger impact than smaller vehicles. The share of the impact of the vehicle (and battery) production is becoming an important contributor to the overall Life Cycle Impact, since on the one hand the environmental impact of electricity production (for battery electric vehicles) is decreasing, and on the other hand the level of tailpipe pollutant emissions (for ‘traditional’ combustion engines) is also decreasing.
- Even with the higher vehicle and battery mass, electric vehicles in general have the lowest Life Cycle Impacts. However, it would be too simplistic to claim that battery electric cars always have a lower environmental impact than any petrol car. The life cycle impact of a heavy electric car with a very large battery can exceed that of eg. a smaller petrol car. However, comparing vehicles of different segments may not be relevant, as consumers usually don’t hesitate between a small car and a heavy SUV.
- Private individuals generally buy smaller models: the average weight of the 10 most popular private cars is significantly lower (-800 kg) than that of the 10 most popular company cars.
- Despite their higher weight, the 10 most popular company cars have a slightly lower average Life Cycle Impact than private cars. This is due to the fact that the top 10 company cars are all fully electric.
- When addressing the environmental impact of products, in this case cars, it is important to not only consider the use phase, but also the impact of the production of the materials used. It is to the credit of the Life Cycle Impact that this has become tangible for cars.