Elevated concentrations of NO2 in the ambient air and the health impact attributable to NO2 exposure are of increasing societal concern. Up until 2017, there was no adequate methodology to assess these health impacts at an EU-wide level. This was largely due to the strong varying spatial gradients of NO2 concentrations in urban areas. To accurately represent these gradients a very high modelling spatial resolution is required which is very demanding in terms of computational load when applied to the whole EU.
To address this, the European Commission commissioned VITO (BE) and King's College London (UK) to develop an improved methodology for NO2 exposure assessment at EU scale. This exercise included an extensive literature review listing different NO2 assessment methodologies and benefitted from recommendations formulated at a dedicated European expert workshop in Bonn on 17 May 2016.
The improved methodology is based on "QUARK – Quick Urban AiR quality using Kernels", which is a modelling approach developed for the fast calculation of urban air quality scenario assessments. The methodology was further refined and applied specifically for NO2 on a European scale, making it possible for source apportionment studies and performing emission reduction scenarios on an EU scale at a high spatial resolution (~100 m). Have a look at our NO2 concentration map for Europe at 100m.
Mapping air quality at street level
Air quality can vary considerably in a city. Concentrations measured on busy roads and streets can be significantly higher than the city’s average concentrations. The ATMOSYS team has built up a strong track record in generating high quality air pollution maps that adequately reflect this spatial variation.
- The core underlying modelling methodology (RIO-IFDM-OSPM) is well demonstrated and validated in peer reviewed publications.
- The methodology accounts for the double counting effects of local sources in the regional and urban background and deals with the complex O3-NOx chemistry.
- The modelling chain has been applied in numerous cities across Europe and at EU-wide level.
- Source apportionment of the different type of sources (regional background, traffic, local heating, and industry) can be provided.
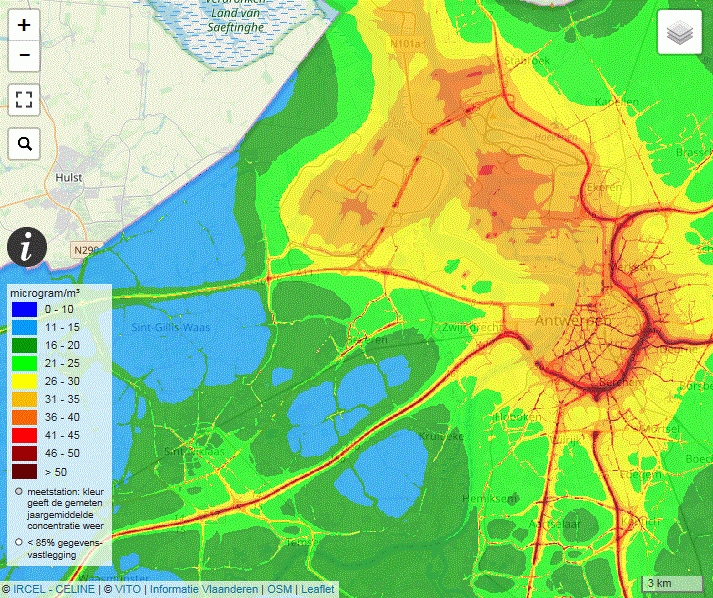
The current annual average NO2 concentrations for Flanders, generated by VITO and are available from the official Flemish Environmental Agency website. Take a zoom on NO2 map.


